Updated 15 October 2026 (first published 27 September 2026)
Disclaimer:
This report is for general information purposes only and is not legal, investment, financial or other professional advice. It draws on third-party sources as of 15 October 2026, and figures may change rapidly and without notice. Seek professional independent advice before making legal, financial and investment decisions.
Starting point
This report sets out where the US economy stands going into the fourth quarter. It builds on two September reports: S&P Global Market Intelligence’s Global Economic Outlook (16 September), a model-based forecast, and the World Economic Forum’s Chief Economists’ Outlook (22 September), based on a survey of 36 chief economists taken 4–20 August.
Both were first updated with market data through the close on Friday 25 September. This 15 October update adds the September jobs and inflation reports, the minutes of the Fed’s September meeting, the IMF’s October World Economic Outlook and market data through 14 October.
October check-in: what the first releases showed
Inflation came in hotter and hiring much weaker than the September PMI suggested. That leaves the Fed weighing a softer labour market against a second month of rising prices.
| Release | What came in | Against the 27 Sept picture |
|---|---|---|
| September jobs report (2 Oct) | Payrolls +29,000; unemployment 4.2%. July and August were revised down a combined 60,000: August from +162,000 to +133,000, July from +21,000 to −10,000. | Did not confirm the PMI’s strongest job creation in over four years |
| Fed minutes (7 Oct) | “Most participants” judged another hike “would likely be appropriate by year end,” while stressing that each meeting is open | Consistent with one more hike this year; no signal of urgency for October |
| IMF World Economic Outlook (13 Oct) | US growth 2.3% in 2026 and 2027. Global inflation 4.7% in 2026 and 4.1% in 2027. Assumes oil averages about $96 this year and Hormuz shipments resume by March. | US growth unchanged from July; 2027 global inflation raised from 3.9% |
| September CPI (14 Oct) | 3.7% year on year (August 3.4%), up 0.6% on the month. Core 2.6% (August 2.4%). Energy up 20.4% on the year; gasoline rose 9.1% in the month and accounted for over half the monthly increase. | The energy shock is starting to show up in core prices |
| US import ban on Canadian goods (29 Sept) | Took effect at 12:01 a.m. ET; CBP said it would reject entry of covered products. We found no report of talks resuming as of 15 October. | Escalation has held; no settlement |
Still to come: the Fed’s 27–28 October meeting, the Q3 advance GDP estimate on 29 October, the Bank of Japan on 29–30 October and the 3 November midterms.
Executive summary
The US economy entered the fourth quarter running hot while households felt squeezed, and the Fed is still tightening into a strained bond market. Two weeks in, output still looks strong, but hiring has slowed sharply and inflation has risen again.
- Activity is strong, hiring is not. The September flash composite PMI hit 58.4, the strongest since July 2021, and S&P read it as about 4% annualized growth for Q3. The official jobs report then showed only 29,000 jobs added in September, with unemployment at 4.2%.
- Inflation is rising again. September CPI was 3.7% (August 3.4%), with energy up 20.4% on a year earlier and core up to 2.6%. Brent was about $106 on 14 October, and the Fed projects PCE inflation of 3.7% at the end of 2026.
- Rates are heading higher. The Fed hiked to 3.75–4.00% on 16 September, and its minutes show most officials expect another hike by year end. The 10-year Treasury reached 5.31% on 5 October and was 5.19% on 14 October. The 30-year mortgage rate is 7.40%.
- Households are not sharing the gains. Labour’s share of output fell to 52.8%, a record low. Consumer sentiment fell to 46.3 in early October, and year-ahead inflation expectations rose to 4.7%.
The main risk is an energy-driven chain: higher oil, more tightening, higher long yields and an equity correction. S&P treats this as a downside scenario, not its base case.
What’s shifted since the source reports
Both reports got the direction right, but two of their calls are already stale. The WEF survey was collected when crude averaged about $84, before September’s jump to around $105.
| Call | Source | Status | As of 27 Sept |
|---|---|---|---|
| Fed is “one and done” after the September hike | S&P, 16 Sept | Stale | 16 of 18 Fed officials expect at least one more hike this year; markets price about 66–70% odds of a hike at the next meeting |
| Global inflation expectations moderating (50% expect a rise, down from 94% in May) | WEF survey, Aug | Stale | Taken before the September oil spike; US consumers’ year-ahead expectations have since risen to 4.6% |
| US growth moderate (two-thirds of economists) | WEF survey, Aug | Understated | September PMI points to about 5% annualized growth |
| Bank of Japan hikes in September | S&P, 16 Sept | Confirmed | Raised to 1.25% on 18 Sept, in a split vote with two dissents |
| Upward pressure on long-term yields | S&P, 16 Sept | Confirmed | 10-year at 5.17%, 30-year near 5.49%, highest since 2007 and 2004 respectively |
| Geopolitics and asset-price correction are the top risks | WEF survey, Aug | Still valid | Houthi attacks on Saudi supply and US–Iran talks are driving oil day to day |
| Fiscal support will cushion less next time | WEF survey, Aug | Still valid | A weak 5-year auction this week added to pressure on yields |
Growth and activity
Output is accelerating: the September PMI signals about 4% annualized growth for Q3, well above Q2’s 1.5%.
- Q2 GDP grew 1.5% annualized, down from 2.1% in Q1. Underlying demand was stronger: real final sales to private domestic purchasers rose 4.2%.
- September flash PMI. Composite 58.4 (August 56.0), services 58.7, manufacturing 57.0. New orders grew at the fastest rate in nearly four and a half years, and payroll growth was the highest in over four years.
- Demand is domestic. Goods exports continued to decline, and services exports rose only modestly.
- Projections. The IMF (July) and the Fed (September) both see 2.3% growth in 2026. The Fed raised its figure from 2.2% in June.
AI investment is a major driver. Google, Meta, Microsoft and Amazon are expected to spend more than $725 billion in 2026. AI companies absorbed close to two-thirds of US venture capital and about a quarter of investment-grade debt issuance over the past year. 78% of WEF economists expect data-centre investment to drive a significant share of global growth.
The build-out carries local costs. 79% of the economists expect significant community pushback, and a May Gallup poll found about three-quarters of Americans opposed data centres in their area.
Inflation and energy
Headline inflation rose to 3.7% in September as the oil spike reached the pump, and core inflation edged up with it.
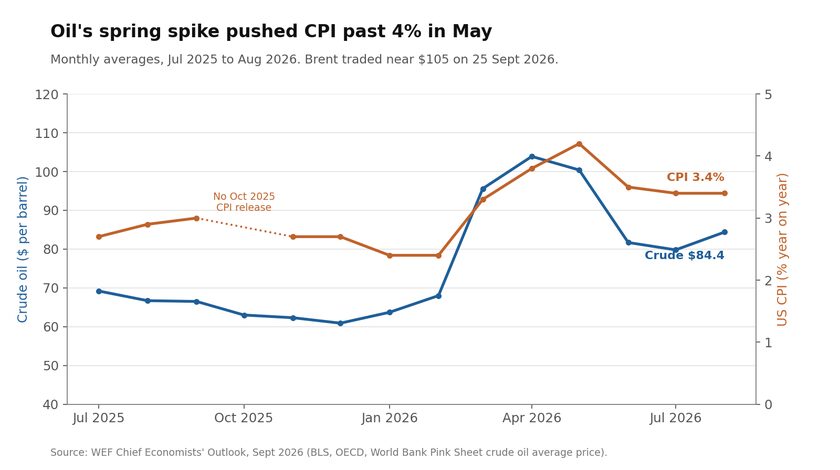
- September CPI (released 14 October) was 3.7% year on year, up 0.6% on the month. Core rose to 2.6% from 2.4%. Energy was 20.4% higher than a year earlier, and gasoline 34.2% higher. Gasoline rose 9.1% in September alone, over half the monthly increase. Shelter rose 0.4% on the month; food was flat.
- August CPI was 3.4% year on year. Core eased to 2.4%, while energy was 16.3% higher than a year earlier.
- Oil. Brent traded around $105 on 25 September, up about 20% over the month, and was about $106 on 14 October. The IMF’s October forecasts assume an average of about $96 this year.
- Refined products. US diesel rose above $6 a gallon for the first time in September, per S&P. The EIA’s weekly on-highway diesel average was $6.18 on 12 October, down from $6.38 on 28 September. Regular gasoline averaged $4.33, down from $4.47.
- Business costs. Input cost growth in the September PMI hit a near four-year high.
- Fed projection. Officials see PCE inflation at 3.7% at the end of 2026.
- Consumer expectations. Year-ahead inflation expectations rose to 4.6% in September and 4.7% in early October. Long-run expectations rose to 3.4% and then 3.5%, the highest since May on both horizons.
S&P noted in September that pass-through to core inflation had been modest. The longer the energy shock lasts, the bigger that pass-through is likely to be. September’s core reading, 2.6% after 2.4%, is the first sign of it.
Monetary policy and rates
The Fed has started hiking and signals more, while long-term yields have jumped to their highest levels in nearly two decades.
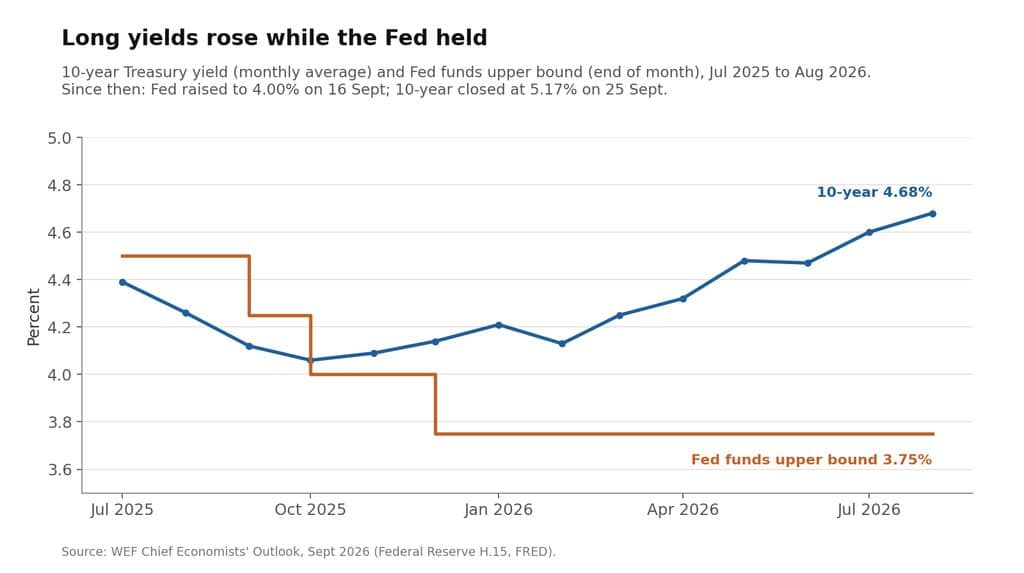
- Fed decision. A 25bp hike to 3.75–4.00% on 16 September, by a 12–0 vote. It was the first move since the December 2025 cut.
- Fed projections. The median end-2026 rate rose to 4.1% (June: 3.8%), implying one more hike. The 2027 median rose to 4.1% (June: 3.6%). 16 of 18 officials see at least one more hike this year, four of them two.
- Fed minutes (7 October). All participants backed the September hike. Most judged that another increase “would likely be appropriate by year end,” while saying decisions would depend on incoming data. Several said the current rate was “not restrictive or only mildly restrictive.”
- Market pricing. On 27 September, markets priced about 66–70% odds of a hike at the late-October meeting. By the time the minutes were released on 7 October, pricing had shifted toward December. Late on 14 October, after the CPI release, CME FedWatch showed about 32% odds of an October hike and about 90% for December, as reported by FinanceFeeds and Benzinga.
- Treasury yields (25 Sept close). 2-year 4.81%, 10-year 5.17% (highest since 2007), 30-year about 5.49% (highest since 2004).
- Treasury yields since. Treasury’s daily par yield curve put the 10-year at 5.31% on 5 October and the 30-year at 5.67% on 7 October, the highest of the month so far. On 14 October they were 5.19% and 5.52%, with the 2-year at 4.82%.
- What moved yields this week. The hot PMI, a weak 5-year auction, hawkish Fed commentary, and a global selloff in Japanese, UK and German bonds.
- Abroad. The ECB raised its deposit rate to 2.50% and the Bank of Japan to 1.25% in September.
Borrowing costs are feeding through. The 30-year mortgage rate was 6.65% in August. Freddie Mac’s weekly survey put it at 7.40% on 15 October, unchanged from the week before, against 6.27% a year earlier.
Fiscal position
Fiscal space is the binding constraint: record debt and rising yields leave less room to cushion the next shock.
- Debt. US public debt reached a record $40 trillion.
- Market pressure. S&P notes the Treasury’s enlarged buybacks did little to stem rising yields. It argues governments may need more market pressure before they address stretched public finances.
- Resilience is shifting away from fiscal support. 69% of WEF economists credit fiscal support as the main source of resilience since 2020, but only 28% expect it to play that role over the next 12 months.
- US fiscal expectations have cooled. 43% expect looser policy, 40% no change and 17% tighter. In May, 62% expected easing.
- Likely responses to living costs (global survey). Tax cuts on essentials (60%), consumption subsidies (54%) and price caps (50%) rank highest. Targeted cash transfers rank last (26%).
Labour market and households
Hiring slowed sharply in September, and households are not sharing the gains: labour’s share of output has hit a record low.
- September payrolls. 29,000 jobs added, and unemployment rose to 4.2% from 4.1%. BLS described both as little changed. Participation was 61.8%.
- Revisions. BLS first reported 162,000 jobs for August and 21,000 for July. It now puts them at 133,000 and −10,000, a combined 60,000 lower.
- Two signals disagree. The September PMI showed the strongest job creation in over four years. The official count for the same month was 29,000.
- Pay. Average hourly earnings rose 0.1% in September to $37.81, while consumer prices rose 0.6%.
- Output is outpacing pay. Productivity rose 1.4% annualized in Q2, while labour’s share of output fell to 52.8%, the lowest since records began in 1947.
- Real incomes. WEF economists are split on US households: 39% expect real incomes to rise, 36% no change and 24% a fall.
- Unemployment outlook. 53% expect no change over the next year, 35% a rise and 12% a fall.
- Sentiment. The Michigan index fell to 47.8 in early September, the weakest since May’s record low and 16% below February, before the Iran conflict began. It finished September at 48.1 and fell to 46.3 in October’s preliminary reading, as buying conditions for durables “plummeted amid high prices and borrowing costs,” the survey said.
- Costs. Food, electricity and transport lead expected cost increases globally (88%, 83% and 77% of economists). 78% expect data centres to push up electricity prices for other consumers.
This gap between strong output and weak household sentiment is the report’s central tension. It matters more if the Fed keeps hiking into it.
Trade and investment
US trade policy is diverging by partner: escalation with Canada, a truce with China.
US–Canada, newest first
| Date | Event |
|---|---|
| 29 Sept (Tue) | US ban on imports of many Canadian dairy products, motorcycles and alcoholic beverages takes effect |
| 15 Sept | US changes to its 50% tariff list take effect, with some items added and others removed |
| 8 Sept | Canada’s counter-tariffs of 15–50% on over 700 US products take effect, matching US measures dollar for dollar; the US announces the import ban the same day |
| 22 Aug | Talks collapse; the US imposes a 50% tariff on Canadian goods (about $20 billion per AP; Ottawa cites $27.6 billion) |
- US–China. The two sides extended their trade truce as President Xi arrived for his first state visit to Washington in 11 years.
- Tariff outlook. 55% of WEF economists expect US tariffs to rise over the next year, and 77% expect global fragmentation to deepen.
- Exports. Expectations for US exports to countries other than China have improved: 39% now expect an increase, up from 9% in January. The PMI still shows goods exports declining.
- Investment. 56% expect FDI into the US to rise, against 23% for China. The US tops the ranking of business environments for multinationals, named in the top three by 77%.
Projection summary
The official projections point to one more Fed hike and growth above 2%, but spot oil is well above S&P’s forecast path.
| Indicator | Latest | Projection | Source | Data date |
|---|---|---|---|---|
| Real GDP | Q2: 1.5% annualized | 2.3% in 2026 and 2027 (IMF); 2.3% in 2026 (Fed) | BEA; IMF (October); Fed | 26 Aug; 13 Oct; 16 Sept |
| Q3 growth signal | Composite PMI 58.4 | About 4% annualized for Q3 | S&P flash PMI | 23 Sept |
| Inflation | CPI 3.7% y/y, core 2.6% (Sept) | PCE 3.7% at end-2026 | BLS; Fed | 14 Oct; 16 Sept |
| Fed funds rate | 3.75–4.00% | 4.00–4.25% at end-2026 and end-2027 (median) | Fed | 16 Sept |
| 10-year Treasury | 5.19% (October high 5.31% on 5 Oct) | No major reversal near term without progress in the Middle East | US Treasury; S&P | 14 Oct; 16 Sept |
| Brent crude | About $106 | $89 at end-2026, $86 at end-2027 (S&P base case, well below spot); IMF assumes a 2026 average of about $96 and $87 in 2027 | Market; S&P Global Energy; IMF | 14 Oct; 16 Sept; 13 Oct |
| Unemployment | 4.2% (Sept) | Q4 projection revised down from 4.3% | BLS; Fed | 2 Oct; 16 Sept |
| Global inflation | 4.1% in 2025 | 4.7% in 2026, 4.1% in 2027 (July: 3.9% for 2027) | IMF (October) | 13 Oct |
The IMF’s October outlook, “Resilience Under Strain, Urgent Choices,” kept US growth at 2.3% and raised global growth to 3.1% for 2026. It assumes oil averages about $96 this year and that Hormuz shipments resume by March. Brent is about $10 above that average, and Hormuz attacks were still being reported in mid-October.
Risk scenarios
The base case is benign, but most of the named risks run through the same channel: energy prices feeding inflation and rates.
| Scenario | What sets it off | How it plays out | What to watch |
|---|---|---|---|
| Base case | Current trends hold | Strong growth, one more Fed hike this year, oil and yields stay elevated | PMIs, jobs, CPI |
| Energy spiral (S&P’s downside) | US–Iran escalation or more attacks on Gulf supply | Higher energy prices, more tightening, higher peaks in long yields, an equity correction | Brent, Strait of Hormuz traffic, Houthi attacks |
| Overheating and bond stress | Hot data keeps the Fed hiking | Weak auctions push long yields higher, raising mortgage and federal borrowing costs | Treasury auctions, 30-year yield, wage data |
| AI and asset-price correction | Doubts over returns on AI investment | Stretched valuations unwind; WEF economists are split on overinvestment (42% yes, 44% no) | Chip stocks, AI capex guidance, credit spreads |
| Trade escalation | Further US–Canada rounds or a break in the China truce | Higher import costs and disrupted supply chains | Tariff lists, the 29 Sept import ban |
| Upside: US–Iran deal | Return to an interim agreement | Oil falls, inflation pressure eases, fewer hikes needed | Negotiation headlines, Brent |
A late-July preview of the correction risk: a US hedge fund fell into distress after chip stocks declined. The 3 November midterms add policy uncertainty; WEF economists are split on their global impact (31% agree it will be significant, 39% disagree).
What October will tell us
October’s releases were set to test the Q4 picture on four fronts: hiring, inflation pass-through, the Fed and trade. The last column records what has come in as of 15 October.
| Date | Release or event | The question it answers | Result so far |
|---|---|---|---|
| 29 Sept | US import ban on Canadian dairy, motorcycles and alcohol takes effect | Does the Canada dispute escalate further, or settle? | Took effect; no report of talks resuming |
| Early Oct (expected 2 Oct) | September jobs report | Does hiring confirm the PMI’s strongest job creation in over four years? | Released 2 Oct: +29,000; unemployment 4.2%. Did not confirm the PMI |
| Mid-Oct (expected) | September CPI | Is the energy spike starting to feed into core inflation? | Released 14 Oct: 3.7%, core 2.6%. Yes, the first signs |
| Mid-Oct (expected) | IMF World Economic Outlook | How far does the oil spike move the official forecasts? | Released 13 Oct: US growth unchanged at 2.3%; 2027 global inflation raised to 4.1% |
| Late Oct (expected 27–28 Oct) | FOMC meeting | Does the Fed deliver the hike markets price at about 66–70%? | Pending. Late on 14 Oct, odds of an October hike were about 32%, of December about 90% |
| Late Oct (expected) | Q3 advance GDP estimate | Did growth come in near the PMI’s 4% signal? | Pending; BEA has scheduled it for 29 Oct |
| 29–30 Oct | Bank of Japan meeting | Does Japan keep tightening despite two dissents in September? | Pending |
| 3 Nov | US midterm elections | Does the result shift fiscal or trade policy? | Pending |
Implications
Going into Q4, the picture points to higher borrowing costs, elevated energy costs and more trade friction than looked likely in the summer.
- Borrowing costs. With the Fed signalling at least one more hike and the 10-year above 5%, new borrowing and refinancing will cost more than earlier in the year. The 30-year mortgage rate has risen from 6.65% in August to 7.40%.
- Energy and input costs. Oil around $106 and diesel still above $6 a gallon raise transport and production costs. Input cost growth in the PMI is at a near four-year high.
- Consumer demand. Strong output has not translated into household confidence. In September, hourly pay rose 0.1% while prices rose 0.6%, so spending is a risk if that gap persists.
- Trade exposure. Businesses trading across the US–Canada border face tariffs of up to 50% and new import bans. China-linked trade looks steadier in the near term under the extended truce.
- Market volatility. Rising yields and stretched valuations leave assets exposed to a correction, particularly those tied to AI.
Appendix
Change log
First published 27 September 2026.
Updated 15 October 2026: added the October check-in and a results column to the October calendar; updated the executive summary, inflation, rates, labour, projection and implications sections with the September jobs and CPI reports, the Fed’s September minutes, the IMF’s October outlook, Treasury yields, oil, fuel and mortgage rates, and the October sentiment survey. BLS revised its July and August payroll figures after first publication; both the original and revised figures are shown. Earlier figures are kept where they mark the 27 September starting point.
Sources
| Source | Data as of | What it is |
|---|---|---|
| S&P Global Market Intelligence, Global Economic Outlook | 16 Sept | Model-based forecast update |
| WEF Chief Economists’ Outlook | Survey 4–20 Aug; data to 16 Sept | Sentiment survey of 36 chief economists, plus cited data |
| Market and economic data | 23–25 Sept | Flash PMI, Treasury yields, oil, Fed projections, BoJ, trade, consumer sentiment |
| October update data | 2–15 Oct | BLS jobs and CPI, Fed minutes, IMF outlook, Treasury yields, Freddie Mac, EIA fuel prices, Michigan sentiment, oil |
Source reports
- S&P Global Market Intelligence, Global Economic Outlook: September 2026 (16 Sept)
- World Economic Forum, Chief Economists’ Outlook: September 2026 (22 Sept; survey 4–20 Aug)
Market and economic data, 23–25 Sept
- S&P Global, US flash PMI, September 2026
- FXStreet, PMI growth read-through
- CNBC, Fed rate decision, 16 Sept
- TradingKey, Fed dot plot detail
- Forbes Advisor, Treasury rates, 25 Sept
- CNBC, Treasury yields, 25 Sept
- Trading Economics, US 10-year yield and rate pricing
- Washington Trust, week in review, 25 Sept
- OilPrice.com, Brent weekly move
- Trading Economics, Brent crude
- Bloomberg, Bank of Japan decision, 18 Sept
- Trading Economics, University of Michigan sentiment, September
- Government of Canada, counter-tariffs effective 8 Sept
- ABC7 / AP, US tariffs on Canada, 22 Aug
- Al Jazeera, Canada’s counter-tariffs take effect, 8 Sept
- CFIB, Canada–US trade war tracker
- SignatureFD, market brief, 25 Sept
Added 15 October
- US Bureau of Labor Statistics, The Employment Situation, September 2026 (2 Oct)
- US Bureau of Labor Statistics, Consumer Price Index, September 2026 (14 Oct)
- Federal Reserve, Minutes of the FOMC, 15–16 September 2026 (7 Oct)
- IMF, World Economic Outlook, October 2026: “Resilience Under Strain, Urgent Choices” (13 Oct), with figures as reported by NWA Democrat-Gazette / AP and SDG News
- US Treasury, Daily Par Yield Curve Rates, October 2026
- Freddie Mac, Primary Mortgage Market Survey (15 Oct)
- US Energy Information Administration, Gasoline and Diesel Fuel Update (14 Oct)
- University of Michigan, Surveys of Consumers, preliminary October 2026 (9 Oct)
- Investing.com, Brent historical prices and Trading Economics, Brent crude (14 Oct)
- Babypips, September FOMC minutes and October pricing (8 Oct); FinanceFeeds and Benzinga on CME FedWatch odds after the CPI release (14 Oct)
- GHY International, CBP guidance on the Canadian import ban (28 Sept) and Spectrum News / AP, ban products and effective date
- DeClassified Now, Hormuz Tanker Attack Tracker (updated 15 Oct)
Disclaimer:
This report is for general information purpose only and is not legal, investment, financial or other professional advice. It draws on third-party sources as of 15 October 2026, and figures may change rapidly and without notice. Seek professional independent advice before making legal, financial and investment decisions.